Result of this series as three minutes Youtube video: Data from home – Info Display
Details for the display: Controlling Samsung Signage QB13R-T based on Unifi Protect
Data from home – setup and preliminary results (Part 1)
Data from home – wireless water meter (Part 2)
Data from home – energy analyzer, requests against webUI (Part 3)
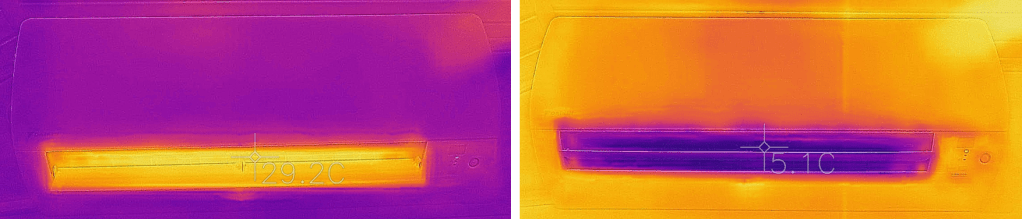
Data from home – district heating, computer vision (Part 4)
Data from home – alerting and water shutoff (Part 5)
I hope you enjoy!
I have been using a setup of Carlo Gavazzi EM111, EM340 and VMU-C in my home for some years already. EM340 is the main electricity meter, EM111 is the meter for a heatpump and VMU-C is the data-collector for both meters. The WebUI for VMU-C gives some pretty insights into the data out of the box.

The VMU-C also supports exporting the data. It can be done against FTP or Azure IoT Hub for example. Both are push based and I have used both of them. There is also HTTP API available to request the data. I wanted to get this data to Grafana as well so I tested the HTTP API.
wget --user-agent=MOZILLA --output-document=myOutputFile "https://IPADDRESS/receiverftp.php?HTTP_VAR_QRY&USERNAME@PASSWORD&$60EPOCHSECONDSAGO&$EPOCHSECONDS&ALL&ALL" --no-check-certificateThe problem with the available push or request methods is that those all query data from the database. Database does not allow storing the data with higher resolution than once per minute. For an engineer like me, it is frustrating to know that the data is read at least once per five seconds but it is not available outside the WebUI.

I even asked the manufacturer about this. Their local representative provided super fast service but unfortunately they did not provide an answer on how to access the real-time data externally. I decided to approach this by mimicking the browser with a Python script to be able to read the real-time WebUI content. This was my first ever touch with the Python so it didn’t come that easy. To acquire the logic I first recorded a normal browser session with the Fiddler.
# Tested against VMU-C firmware A14_U09

import requests, re, time

# variable used for requests
LOGIN_URL = "http://VMUCIP/login.php"
# main meter
ENDPOINT_URL = 'http://VMUCIP/EngineEmRealtime.php?id=9'
# heatpump meter
ENDPOINT_URL2 = 'http://VMUCIP/EngineEmRealtime.php?id=8'
# pushgateway urls
PM_URL = "http://localhost:9092/metrics/job/vmucpm"
ILP_URL = "http://localhost:9092/metrics/job/vmucilp"

# first get against VMU-C WebUI to acquire csrfp token
client = requests.session()
client.get(LOGIN_URL)
csrftoken = client.cookies['csrfp_token']

# login, updating csrfp token
login_data = {'username':'USERNAME', 'password':'PASSWORD', 'Entra':'SignIn', 'csrfp_token':csrftoken}
r1 = client.post(LOGIN_URL, data=login_data)

# ready to request data from realtime engine with an infinite loop
while True:
 r3 = client.post(ENDPOINT_URL)
 r4 = client.post(ENDPOINT_URL2)
 # regex to find header - value pairs
 ready1 = "\n".join(re.findall(r'\w+\t\-?\d+\.\d+', r3.text)) + "\n"
 ready2 = "\n".join(re.findall(r'\w+\t\-?\d+\.\d+', r4.text)) + "\n"
 client.post(PM_URL, data=ready1)
 client.post(ILP_URL, data=ready2)
 time.sleep(5)
It seems that you can run the query even more often than once per five seconds. This time I decided that I am not going to try if my VMU-C can survive for prolonged periods of querying once per second. So my resolution is once per five seconds for now. Again some Grafana queries to start with:
# Current for L1 as a percentage of 25A fuse
Al1{job="vmucpm"}/25*100

# Power for L1
kWl1{job="vmucpm"}

# Power for heat pump
kWsys{job="vmucilp"}
My electricity dashboard looks like this now.

Now I can for example demystify energy usage of my heatpump (Daikin 4MXS68F multisplit with four indoor units). Following graph shows heating in the morning and cooling in the evening. So far I have seen almost 3 kW peaks for heating and much lower values for cooling. Inverter technology seems to be working nicely as well. Especially for cooling the lowest power level is actually pretty low, around 150 W. This means that even 24/7 usage in the summer should not cause extensive costs.

The technique used within this post was interesting to implement. The next one is even more interesting, I think.
