Result of this series as three minutes Youtube video: Data from home – Info Display
Details for the display: Controlling Samsung Signage QB13R-T based on Unifi Protect
Data from home – setup and preliminary results (Part 1)
Data from home – wireless water meter (Part 2)
Data from home – energy analyzer, requests against webUI (Part 3)
Data from home – district heating, computer vision (Part 4)
Data from home – alerting and water shutoff (Part 5)
I hope you enjoy!
After we had moved to our current house we were going to fix some technical flaws like getting installed the missing constant pressure valve for water. It was a good time to add some capabilities for the home automation in the same time. One of these was that I wanted to have an own water meter for our household. I also wanted it to have an interface for reading it with a computer. After some searching I ended up selecting Kamstrup FlowIQ3100, an ultrasonic meter with wireless reading capability.
If I were to select the meter now I would go with a wired model instead, since with such I could read wider range of data with higher resolution. With this wireless model I am getting one transmit every 16 seconds and the only information I am using so far is the total reading.
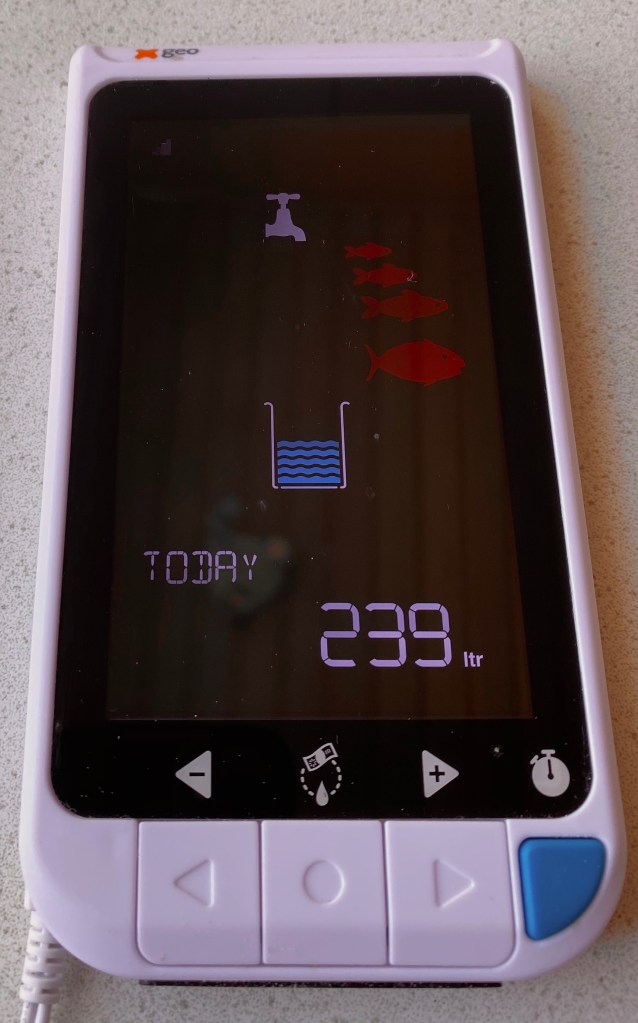
I also purchased a home display as a starters for realtime feedback of water usage to me and my family. Even the kids were quite interested to follow if we managed to keep the water usage low.
Obviously this wasn’t exactly what I had in my mind. So after some digging I learned that the data transmission is based on a Wireless M-Bus. I managed to find iM871A-USB Wireless M-Bus receiver, an USB receiver for this purpose.

I tried to receive and read the messages the meter was sending. The message is encrypted, but I had already acquired the encryption key from the distributor of the meter. Still, I was getting nowhere. Then I found wmbusmeters from the github. This project has been quite active and the author was genuinely nice when I asked for a help.
I started with Azure – a natural choice for me. I used multiple components from the cloud and got some results as well! I have to admit I was struggling with the JSON and how Azure handled it trying to save messages to blob storage. The biggest problem for me was that I was using billable components. Although those are reasonably priced for the enterprise usage I could not justify the cost for my personal use case. This is were I was stuck for a long time.
Then I went back to the github to check what was going on with the wmbusmeters project. I came across with instructions on how to integrate with some of the most used home automation projects. So I set up Domoticz. It was quite easy to get the meter reading visible. Still, I was not happy. I think the database solution with visualization included was not what I was looking for (or then I just did not know how to do it). The biggest thing at this point was that I had the inspiration again!
I did some more research and ended up choosing Prometheus as the timeseries database and Grafana for the visualization. Since Prometheus itself does not support pushing data to the database I also needed something in the middle and that is where Pushgateway does the trick. So I set those up and configured wmbusmeters to send the meter readings to the Pushgateway by adding one line to the wmbusmeters.conf:
shell=echo "total_m3 $METER_TOTAL_M3" | curl --data-binary @- http://localhost:9091/metrics/job/pushgateway
On the Grafana side I finally get what I wanted. I have full resolution data available and I can do anything with it within my imagination and skills. For starters, I am querying the meter reading and calculating flow per minute, per hour and per day values out of it:
# Current meter reading
total_m3{job="pushgateway"}

# Flow per minute
rate(total_m3{job="pushgateway"}[60s])*1000*60

# Flow per hour
rate(total_m3[1h])*1000*60*60

# Flow per day
rate(total_m3[24h])*1000*60*60*24
After setting up legends, minimal time interval, visualization styles, units, labels and heading I am ready with my initial dashboard. Things are now going into the direction I had visioned for quite some time. For me this is something really beautiful compared to the original home display.

As you can see there is one day with usage of 1250 liters of water. Since then we have been following this graph more carefully. Since the Coronavirus started we have been all home. That means a lot of dishes and bathing. I am pretty happy that we have been able to keep the usage around 500 liters per day. I think that is pretty good for a family of five persons.

Interesting although the technical is to me rather complecating. Still I’m waiting for part 3 of your experiment. Keep up the good and inspiring work. Well done. Mikael
LikeLike
Thanks for your comment! Balancing on the technical details is not an easy task for me either. I will try to provide some overview for the results in every post in a way that it won’t require to understand the technical details.
LikeLike