Update 29.4.2021:
After struggling for some time with reliability issues, I upgraded the camera.
Result of this series as three minutes Youtube video: Data from home – Info Display
Details for the display: Controlling Samsung Signage QB13R-T based on Unifi Protect
Data from home – setup and preliminary results (Part 1)
Data from home – wireless water meter (Part 2)
Data from home – energy analyzer, requests against webUI (Part 3)
Data from home – district heating, computer vision (Part 4)
Data from home – alerting and water shutoff (Part 5)
I hope you enjoy!
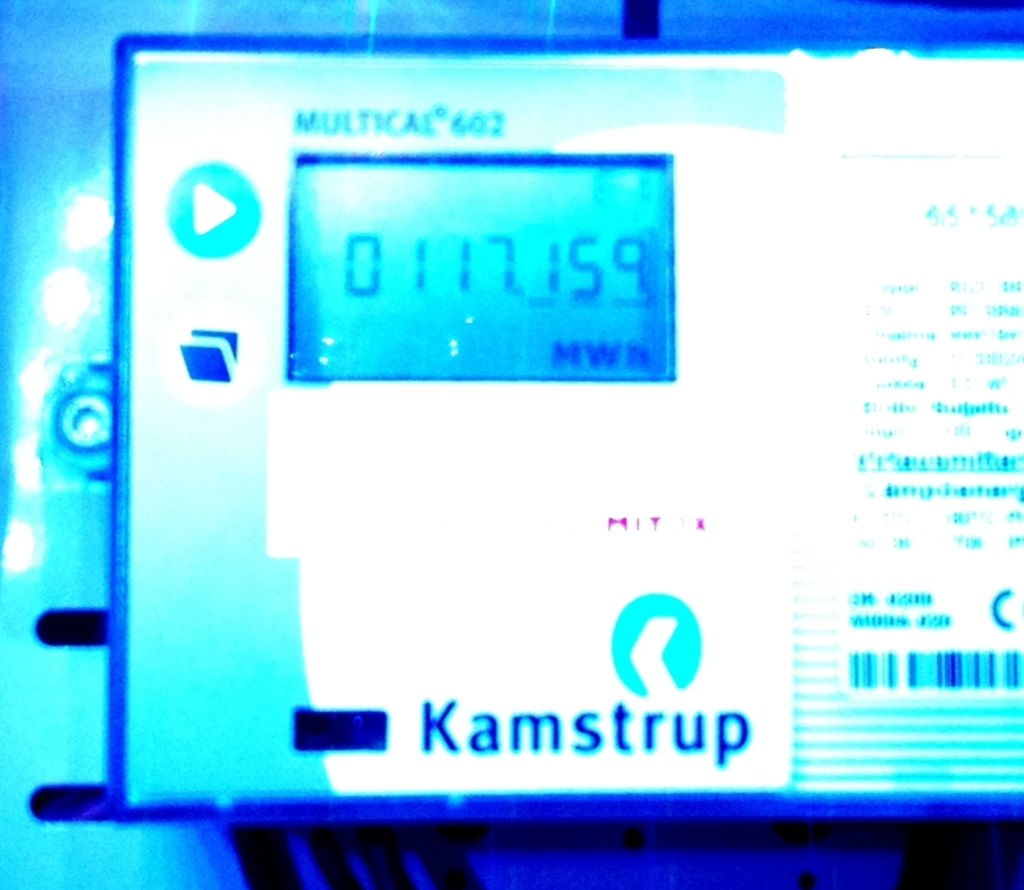
The next challenge within gathering more data was the district heating meter. The meter happens to be manufactured by Kamstrup just like my water meter. While water meter is my own, this heating meter is sealed by local district heating company. They offer pulse output installation for a price of over 400€, which is too much for me. Luckily the meter has a default display with the meter reading. So what could be more interesting than learning to read that display with a camera?
First I started with some optical character recognition (OCR) programs like tesseract.

It came quickly obvious that it is hard to read my meter display with OCR. This is since in the display numbers are presented with a seven segment display. This time I found OCR program specialized for reading seven segment displays. So I tested out the ssocr. Trying it out on my water kettle with a backlit LCD gave promising results.

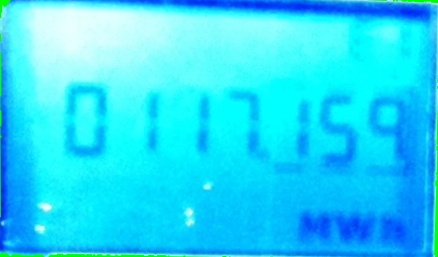
In my meter I have an unlit LCD. To make things even worse I am taking photos of it with Raspberry Pi 2 Model B and Camera Module V2, which does not provide very good quality. After experimenting for some time with the ssocr I decided it is time to try out something different. I found this excellent blog by Adrian from pyimagesearch with an example that fits my situation perfectly: “Recognizing digits with OpenCV and Python“. So I set up my camera and gave it go!
Being still new with Python and first timer with the OpenCV there was going to be some learning ahead. I approached Adrian’s blog post by running one step at the time and trying to get to similar results as he had. I think the image quality made the process at least hard enough so I took some liberties, first of which was to crop image so that the meter case will not end up as complete to the picture to help finding the display. Otherwise I would end up with the display not being the largest rectangular object. I also draw black lines around the display with a marker to make contrast a bit bigger.

This computer vision based approach is forgiving in a way that you don’t have to make pixel per pixel crop or alignment. OpenCV will find the display and make it rectangular for you even if the photo differs from take to take.
Then its time to make some image manipulation trying to make the numbers as clear as possible. In this display there are borders surrounding the last three digits which makes it even harder. The decimal point is not making things any easier either.

Lets continue with photo taken by Raspberry Pi Camera V2. It looks already really easy to read by human eye. For the method used here, the biggest problem is the gaps between segments inside the digits.

After making some more manipulation the image is ready for the next step. Again I decided to make a rough crop from top and bottom parts of the image to get rid of error prone noise in the image.


The rest of the process goes pretty much according to Adrian’s blog. Along the process I had to make quite some adjustments to the script. For example the seven segment representation of the digits in my display is a bit different from the example so I had to adjust the dictionary accordingly. I also decided to go with full resolution available. The most of the image manipulation is based on MORPH_OPEN and MORPH_CLOSE functions.
# Removing spots
kernel2c = cv2.getStructuringElement(cv2.MORPH_ELLIPSE, (7, 9))
threshc = cv2.morphologyEx(threshc, cv2.MORPH_OPEN, kernel2c)

# Handling disconnected segments within digits
kernel2d = cv2.getStructuringElement(cv2.MORPH_ELLIPSE, (8, 12))
threshd = cv2.morphologyEx(threshc, cv2.MORPH_CLOSE, kernel2d)
To be honest, the process is not 100% accurate yet. So I took some more liberties and made the following check within the script.
# Check if last known reading is available. Compare and only allow same or up to .002 bigger values to be accepted
if(cachedold > 0):
if((float(digits0) >= float(cachedold)) and (float(digits0) <= (float(cachedold) + 0.002))):
client = requests.session()
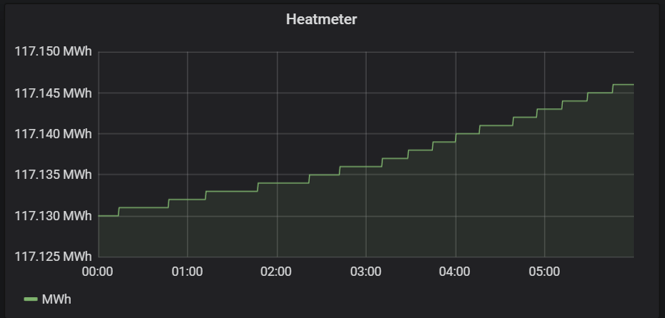
client.post(KL_URL, data=ready)The result is that reliability is good enough for now. I am getting the reading consistent to the Grafana.
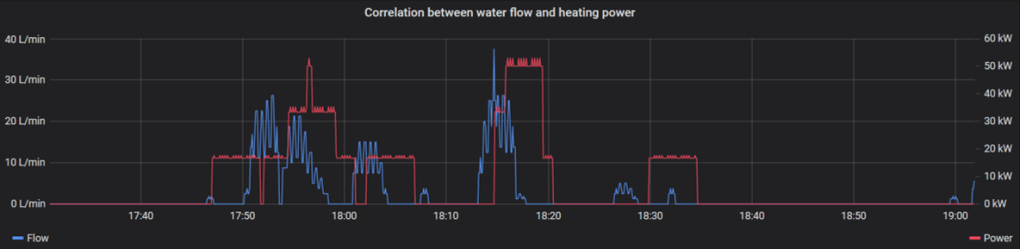
Combined with the data from the previous parts I can now try to make correlation between water flow and heating power. This would look a lot nicer if I had higher resolution available. Unfortunately the display of the meter is showing only to the kWh resolution.
During these couple of weeks I have had a couple of breaks where reading has failed so bad that eventually my cached value check has stopped updating the values totally. I am planning on changing the lights for my camera as soon as I get the new ones. Hopefully it will make image quality a bit better and the process more robust.
