Result of this series as three minutes Youtube video: Data from home – Info Display
Details for the display: Controlling Samsung Signage QB13R-T based on Unifi Protect
Data from home – setup and preliminary results (Part 1)
Data from home – wireless water meter (Part 2)
Data from home – energy analyzer, requests against webUI (Part 3)
Data from home – district heating, computer vision (Part 4)
Data from home – alerting and water shutoff (Part 5)
I hope you enjoy!
Being environmentally friendly and economical are easy reasons for this story. Of course the motto of this blog applies – “Just Because I can”! And even further – “Engineers view to the world”. Most of the people won’t see any value for this but hopefully you will find it as interesting as I do. I am planning to write a series of posts around this topic. This first post is about the setup and some preliminary results.
In our last house I started playing around with the home automation a couple of years ago. We had remotely controlled heatpumps, sophisticated energy metering and temperature meters. I used Azute IoT Hub, PowerBI and a couple of other components to achieve a near real-time dashboard like shown in the picture.

After moving to our current house I wanted to do something more. In my mind I had the following requirements:
- Data: Energy (electricity and heat), temperature and water meters, leak detectors
- Functionality: Meter data collection and reporting, protection against water leakage
- Non-functional: Opensource software running locally
After getting nowhere for the two first years I have finally made some progress. I’m running all this on Intel NUC based WMware Free Hypervisor. OS for this case is Ubuntu. I have been playing around with this for roughly a month now. I’m pretty happy with where I am now, considering that almost every component was totally new to me. Current setup consist of the following:
- Fetching the data and saving it: Pushgateway & Prometheus
- Visualization of the data and alerting: Grafana
- Metering and reading the water meter data: Kamstrup FlowIQ3100 water meter & iM871A-USB Wireless M-Bus receiver & wmbusmeters
- Metering electricity: Carlo Gavazzi EM111, EM340 & VMU-C
- Reading the district heating meter: Raspberry Pi 2 Model B & Camera Module V2
- Water supply main valve with a remote control: OUMAN M110C13 & D-Link DSP-W115
- Leak detection: Honeywell Lyric
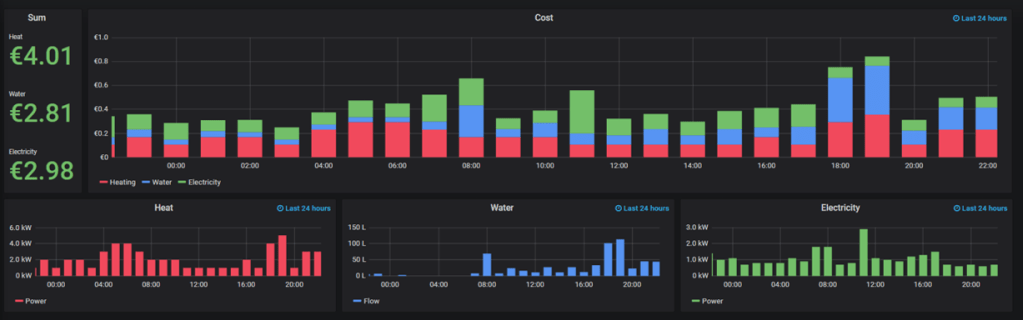
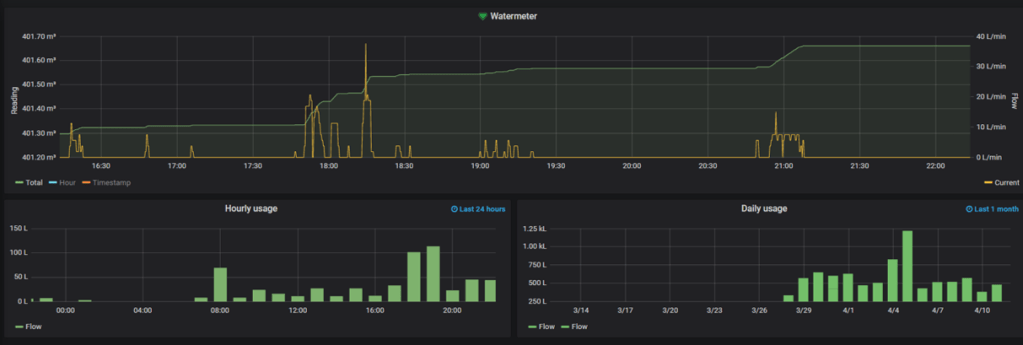
- Python for fetching and reading the data and pushing it to the database
All of the above software has quite good documentation available, so setting it up was doable, although not that easy for me. After recording the data for a couple of days my data looks now like this. I am going to go deeper in to the details in the upcoming posts. Feel free to leave me comments, questions or ideas!