This time I’m going to share you a short demonstration of what you can achieve with the PowerApps. My case here is a user who needs self service control over some aspects of his virtual machine. In this case I’m going to demonstrate giving this user access to a “turbo boost” self service functionality. I assume that he usually get’s along well with small VM but every now and then requires plenty more of CPU capacity.
Starting from small
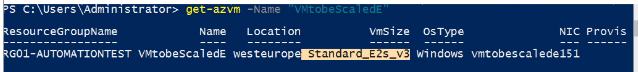
This is the initial setup for this demonstration. A E2s_v3 sized VM.
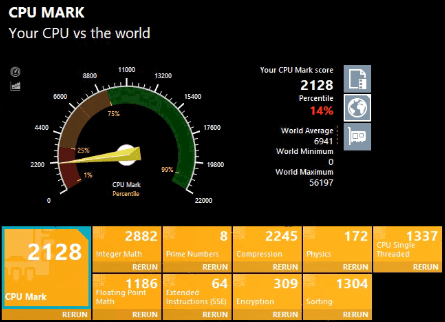
To get some data for comparison I’m going to run Prime95 benchmark and PassMark Performance test. Results are just as expected, with cheap VM size you cannot expect high performance.
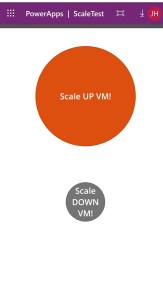
Then it’s time to give the user the tools he needs! Let’s welcome a PowerApp called “ScaleTest”. This is published as a website and is fully accessible with a mobile phone.
Scaling vertically when needed
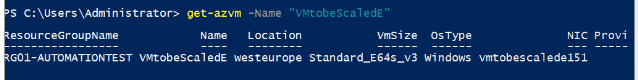
The user can launch the scale up process from the “ScaleTest” application. In the background the PowerApp calls an Azure automation runbook. This time it’s a powershell runbook with predefined values defining which VM to scale and desired size after scaling. After the runbook takes action the VM will restart. The hole process from pressing the button to finnish takes some 1-2 minutes. As a result we have a E64s_v3 VM instead of the E2s_v3 that we started with.
After the scale up I’m running the same tests again to see what kind of differences this makes.
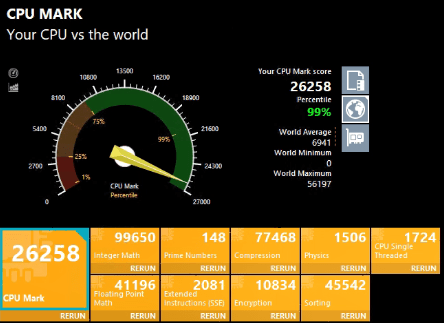
For the Passmark total result we are seeing over 10 times the performance. For individual results the difference is even bigger (~30 times difference). Yey, this time hitting top 1% of submitted results!
| Test | Performance difference |
| 2048K FFT | 20,5 |
| 2048K FFT | 19,6 |
| 2304K FFT | 21,2 |
| 2304K FFT | 20,3 |
| 2400K FFT | 21,7 |
| 2400K FFT | 20,3 |
| 2560K FFT | 21,3 |
| 2560K FFT | 20,3 |
| 2688K FFT | 23,2 |
| 2688K FFT | 21,9 |
| 2880K FFT | 22,5 |
| 2880K FFT | 20,9 |
| 3072K FFT | 21,7 |
| 3072K FFT | 21,6 |
| 3200K FFT | 26,5 |
| Average | 21,6 times the performance of initial setup |
For the Prime95 we are also seeing over 20 times performance boost. The difference obviously depends on the workload used. And of course scaling vertically is somewhat cumbersome compared to horizontal scaling options but sometimes it’s the only possibility.
Results
The user gets control of things with ease. For a newbie like me, it took less than a day to learn how to use Azure automation and PowerApps enough to create this demonstration.
If there would be an actual use case like this I would have achieved the following:
- Self service
- Cost efficiency (running small most of the time)
- Business benefits (running large when you need it)
Same magic works for scale down as well. You can combine what ever you need with this process. Perhaps you want to schedule forced scale down for every evening? Or scale down based on low CPU usage metrics? Or give the user access to some completely different aspects of his resources.
This content was brought to you “Just Because I Can”!
